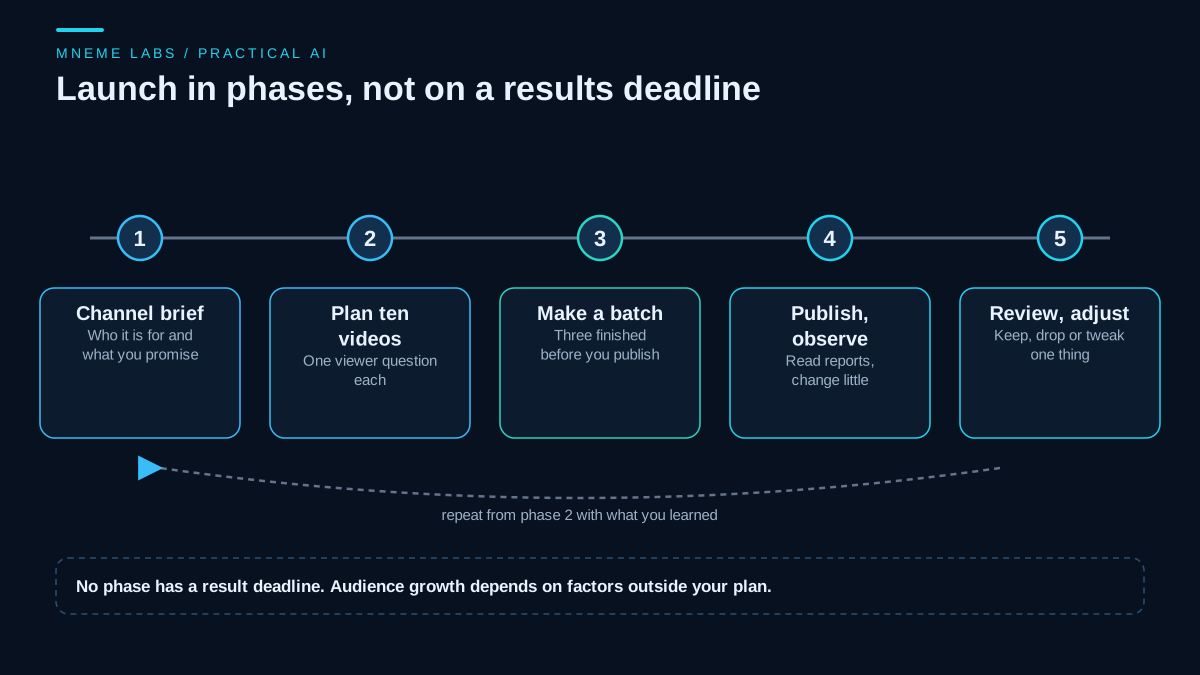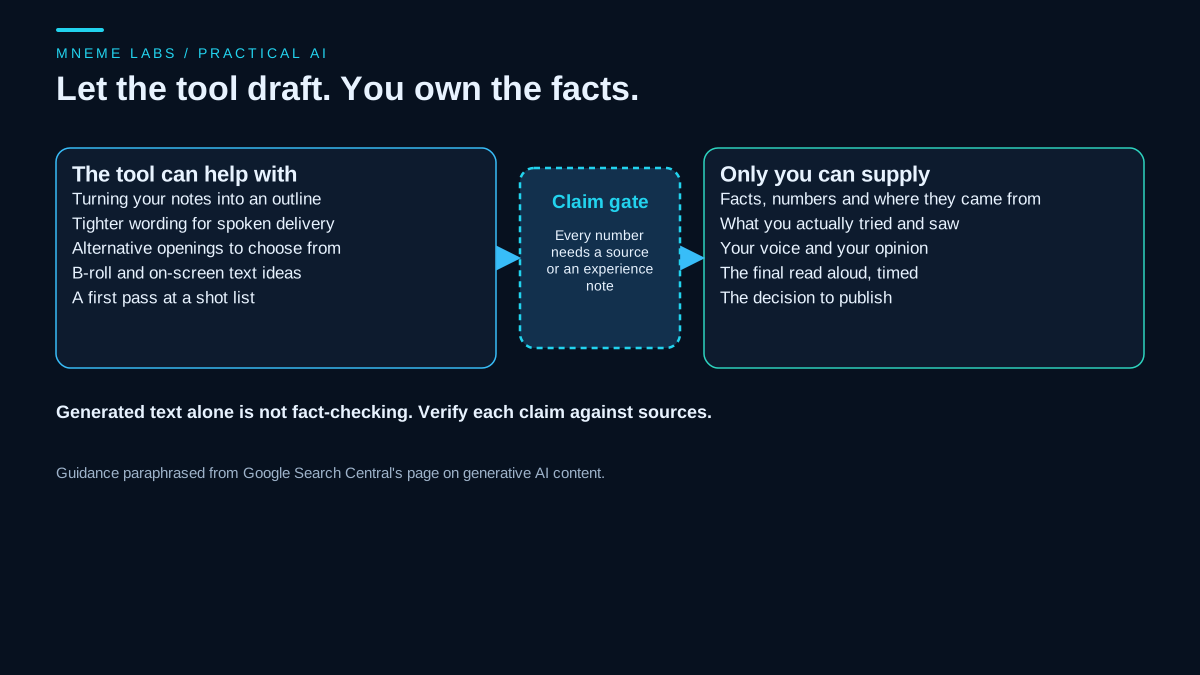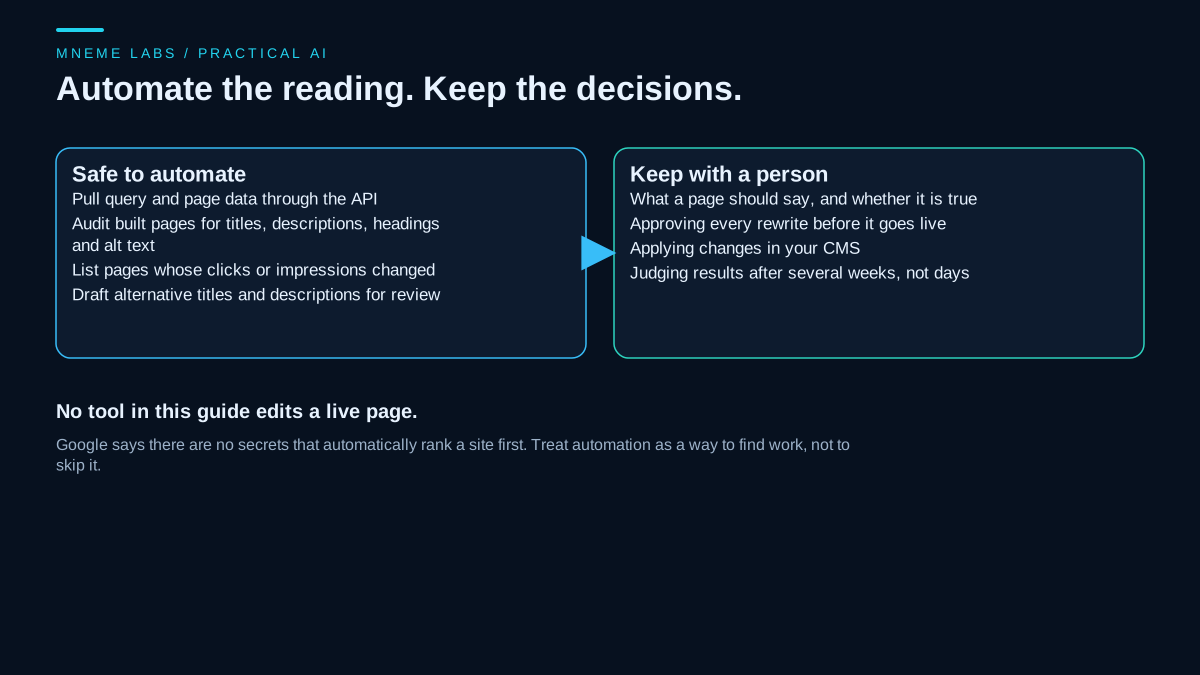
Nobody can honestly tell you how many days it will take to reach 1,000 subscribers. The number depends on your topic, your competition, how often viewers see your videos, and a lot of chance. An AI tool does not change that, and any guide that attaches a date to the goal is guessing.
What you can do is learn from the data your channel already produces. This guide is about subscriber data: which of your videos gained the most subscribers for the views they received, how to read those rates next to the counts behind them, and what the 1,000 subscriber milestone does and does not mean. AI can help with the language work, such as summarizing what you found and brainstorming experiments. The arithmetic belongs in a script, and the decisions belong to you. If you are still planning the channel itself, start with the channel launch guide.
What the reports actually measure
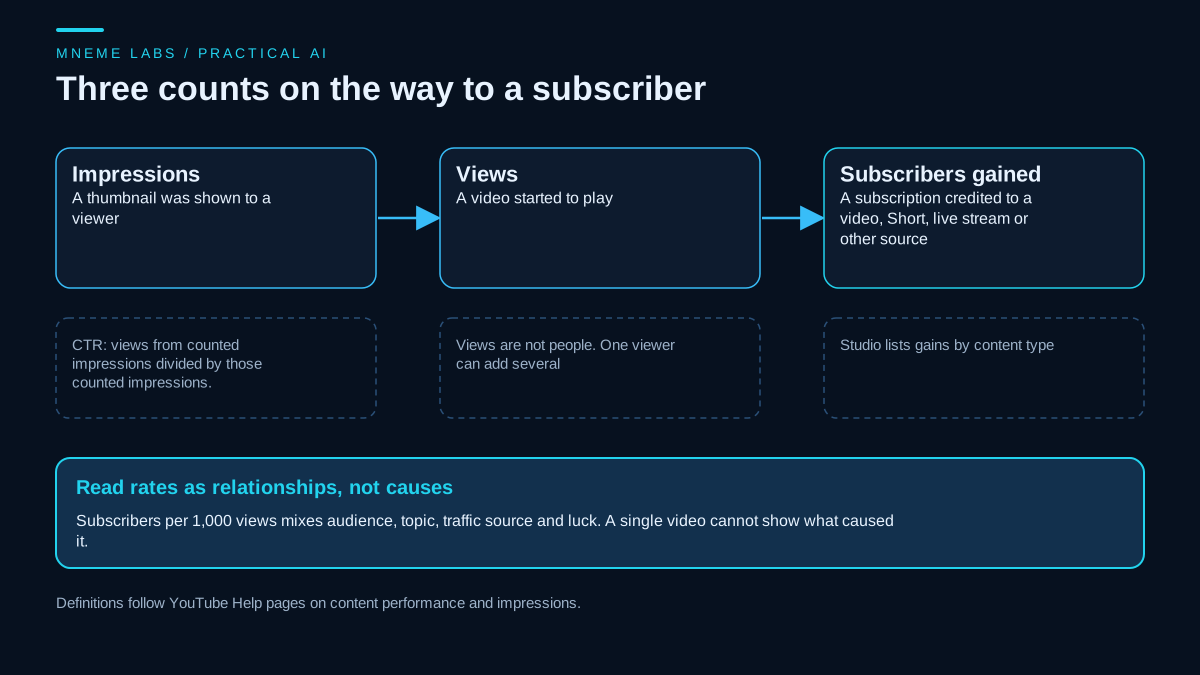
YouTube's Help page on content performance describes the Subscribers report as the number of subscribers you gained from each content type: videos, Shorts, live streams, posts, and others. It says "others" include subscriptions that came from YouTube search and your channel page, and that the report helps you see which content is best at turning viewers into subscribers. The same page defines views as counted when a video starts to play. A view is not a person, and one viewer can generate several.
Impressions are a separate count. The Help page on impressions and click-through rate says click-through rate measures how often viewers watched a video after a counted impression, and that it likely covers only a subset of your total views, since views from external sites, for example, do not start from a thumbnail impression. That page also warns against three habits that matter here: deciding without enough data, chasing small changes in click-through rate, and testing several thumbnails or titles on the same video, because the audiences may differ and the difference may come from traffic sources instead of the thumbnail.
So three different counts sit on the path to a subscriber. A rate between any two of them describes a relationship. It does not prove that a change in one caused a change in the other.
Get the data out
The Help page on Advanced Mode explains that you can compare videos and date ranges, filter by things like subscription status, and export the current view. YouTube has been changing the names of these screens, so look for an export option in the expanded report. Export a table with one row per video that includes views and subscribers gained. Do not include personal data from comments or other sources in anything you paste into an AI tool.
Check the exported file before you trust any total. Some exports include a summary row labeled Total next to the one row per video. If that row stays in, every view and subscriber is counted twice. Column names also vary by export, so the script below lets you name the columns on the command line.
A script that reports counts next to rates
Rates built on small counts jump around. A Short with 3 new subscribers from 120 views works out to 25 subscribers per 1,000 views, and one more subscriber would move it to 33. The script below prints, for each video, the view count, the subscriber count, and subscribers gained per 1,000 views, so a rate never appears without the counts behind it. It also prints the pooled rate for all included videos together and the difference between each video and that pooled rate. Videos under a view count you choose are marked low volume. That cutoff is an editorial rule for deciding where to look twice. It is not a statistical threshold, and a video above it is not shown to be reliable.
The script does not compute confidence intervals or significance tests, and it does not estimate the probability that a viewer subscribes. Views are not independent trials and not unique people, so those methods do not fit this data. The rates describe what already happened and make no claim about cause.
Three input details matter. A row labeled Total is skipped, so the individual videos and the summary line are not added together. Rows with missing, zero, negative, fractional, or non-numeric counts are skipped too, including values such as NaN, Infinity, and 1.2K, and each skipped row is listed with its reason, so a bad cell stays visible. If a summary row carries a different label, the script warns when one row equals the sum of all the others.
"""sub_rate.py: list subscribers gained per 1,000 views for each video. Standard library only.

  python sub_rate.py export.csv [--views-col Views] [--subs-col "Subscribers gained"] [--title-col Title] [--min-views 1000]

Reads a CSV exported from YouTube Studio (one row per video). Column names differ by export, so set them
with the flags. For each video it prints the view count, the subscriber count and subscribers per 1,000
views, plus the pooled rate for all listed videos together.

This is descriptive arithmetic, not a statistical test. Views are not independent trials and not unique
viewers, so the script gives no confidence interval, no significance verdict, no cause, and no probability
that a viewer subscribes. "Low volume" is an editorial cutoff set with --min-views. It marks small counts
for a second look. It does not mean a rate above the cutoff is reliable.

Skipped rows are listed with a reason: missing values, zero views, text that is not a plain whole number
(NaN, Infinity, 1.2K, fractional counts), negative counts, or more subscribers than views. A row labeled
"Total" in the title column or the first column is the export's summary line. It is excluded so views and
subscribers are not counted twice. A real video titled "Total" must be renamed first.
Exit code 2 on unreadable input or when no usable rows remain.
"""
import argparse
import csv
import re
import sys
from decimal import Decimal

MISSING = {"", "-", "--", "n/a", "na", "null", "none"}
PLAIN = re.compile(r"[0-9]+(\.[0-9]+)?")
GROUPED = re.compile(r"[0-9]{1,3}(,[0-9]{3})+(\.[0-9]+)?")
NEGATIVE = re.compile(r"-[0-9]+(\.[0-9]+)?")


def parse_count(cell):
    """Return ("ok", int), ("missing", None) or ("invalid", reason). Never returns NaN or Infinity."""
    text = ("" if cell is None else str(cell)).strip()
    if text.lower() in MISSING:
        return "missing", None
    if GROUPED.fullmatch(text):
        text = text.replace(",", "")
    if NEGATIVE.fullmatch(text):
        return "invalid", "negative count %s" % text
    if not PLAIN.fullmatch(text):
        return "invalid", "not a plain number %r" % text[:20]
    value = Decimal(text)
    if value != value.to_integral_value():
        return "invalid", "fractional count %s" % text
    return "ok", int(value)


def is_total(row, label_cols):
    return any((row.get(c) or "").strip().lower() == "total" for c in label_cols)


def looks_like_total(kept):
    """Return the title of a row whose counts equal the sum of all the other rows, else None."""
    if len(kept) < 3:
        return None
    all_v = sum(k["views"] for k in kept)
    all_s = sum(k["subs"] for k in kept)
    for k in kept:
        if k["views"] * 2 == all_v and k["subs"] * 2 == all_s:
            return k["title"]
    return None


def analyse(rows, views_col, subs_col, title_col, min_views):
    first_col = next(iter(rows[0])) if rows else None
    label_cols = [c for c in (title_col, first_col) if c]
    kept, skipped, total_rows = [], [], 0
    for i, r in enumerate(rows, start=1):
        if is_total(r, label_cols):
            total_rows += 1
            continue
        title = (r.get(title_col) or "").strip() or "data row %d" % i
        v_state, v = parse_count(r.get(views_col))
        s_state, s = parse_count(r.get(subs_col))
        if v_state == "invalid":
            skipped.append((i, title, "views: " + v))
        elif s_state == "invalid":
            skipped.append((i, title, "subscribers: " + s))
        elif v_state == "missing" or s_state == "missing":
            skipped.append((i, title, "missing value"))
        elif v == 0:
            skipped.append((i, title, "zero views"))
        elif s > v:
            skipped.append((i, title, "more subscribers than views"))
        else:
            kept.append({"title": title, "views": v, "subs": s, "per_1000": 1000.0 * s / v, "low_volume": v < min_views})
    total_v = sum(k["views"] for k in kept)
    total_s = sum(k["subs"] for k in kept)
    pooled = 1000.0 * total_s / total_v if total_v else None
    return {"videos": kept, "skipped": skipped, "total_rows": total_rows, "views": total_v, "subs": total_s,
            "pooled": pooled, "maybe_total": looks_like_total(kept)}


def main():
    ap = argparse.ArgumentParser()
    ap.add_argument("path")
    ap.add_argument("--views-col", default="Views")
    ap.add_argument("--subs-col", default="Subscribers gained")
    ap.add_argument("--title-col", default="Title")
    ap.add_argument("--min-views", type=int, default=1000)
    a = ap.parse_args()
    if a.min_views < 0:
        ap.error("--min-views cannot be negative")
    try:
        with open(a.path, encoding="utf-8-sig", newline="") as fh:
            rows = list(csv.DictReader(fh))
    except (OSError, UnicodeDecodeError, csv.Error) as err:
        print("cannot read: %s" % err, file=sys.stderr)
        return 2
    if not rows or a.views_col not in rows[0] or a.subs_col not in rows[0]:
        print("columns not found. Available: %s" % (list(rows[0].keys()) if rows else "none"), file=sys.stderr)
        return 2
    res = analyse(rows, a.views_col, a.subs_col, a.title_col, a.min_views)
    if not res["videos"]:
        print("no usable rows", file=sys.stderr)
        for line, title, why in res["skipped"]:
            print("skipped data row %d (%s): %s" % (line, title[:28], why), file=sys.stderr)
        return 2
    print("included %d videos: %s views, %s subscribers gained" % (len(res["videos"]), format(res["views"], ","), format(res["subs"], ",")))
    print("pooled rate: %.1f subscribers per 1,000 views (all included videos together)" % res["pooled"])
    if res["total_rows"]:
        print("excluded %d Total row(s) so counts are not doubled" % res["total_rows"])
    if res["maybe_total"]:
        print("WARNING: '%s' equals the sum of the other rows. If it is a summary line, remove it." % res["maybe_total"])
    for k in sorted(res["videos"], key=lambda x: -x["per_1000"]):
        note = "low volume (editorial cutoff: under %s views)" % format(a.min_views, ",") if k["low_volume"] else ""
        line = "%-26s %7s views %5s subs %6.1f per 1k %+6.1f vs pooled  %s" % (
            k["title"][:26], format(k["views"], ","), format(k["subs"], ","), k["per_1000"], k["per_1000"] - res["pooled"], note)
        print(line.rstrip())
    for line, title, why in res["skipped"]:
        print("skipped data row %d (%s): %s" % (line, title[:28], why))
    return 0


if __name__ == "__main__":
    sys.exit(main())
What it showed on synthetic data
The script was run on a made-up table with six videos and a Total row, followed by eight rows that were deliberately unusable: a row with no values, one with zero views, one with NaN views, one with Infinity views, one with a fractional subscriber count of 7.5, one with more subscribers than views, one with a negative subscriber count, and one with views written as 1.2K. This is the output:
included 6 videos: 17,520 views, 155 subscribers gained
pooled rate: 8.8 subscribers per 1,000 views (all included videos together)
excluded 1 Total row(s) so counts are not doubled
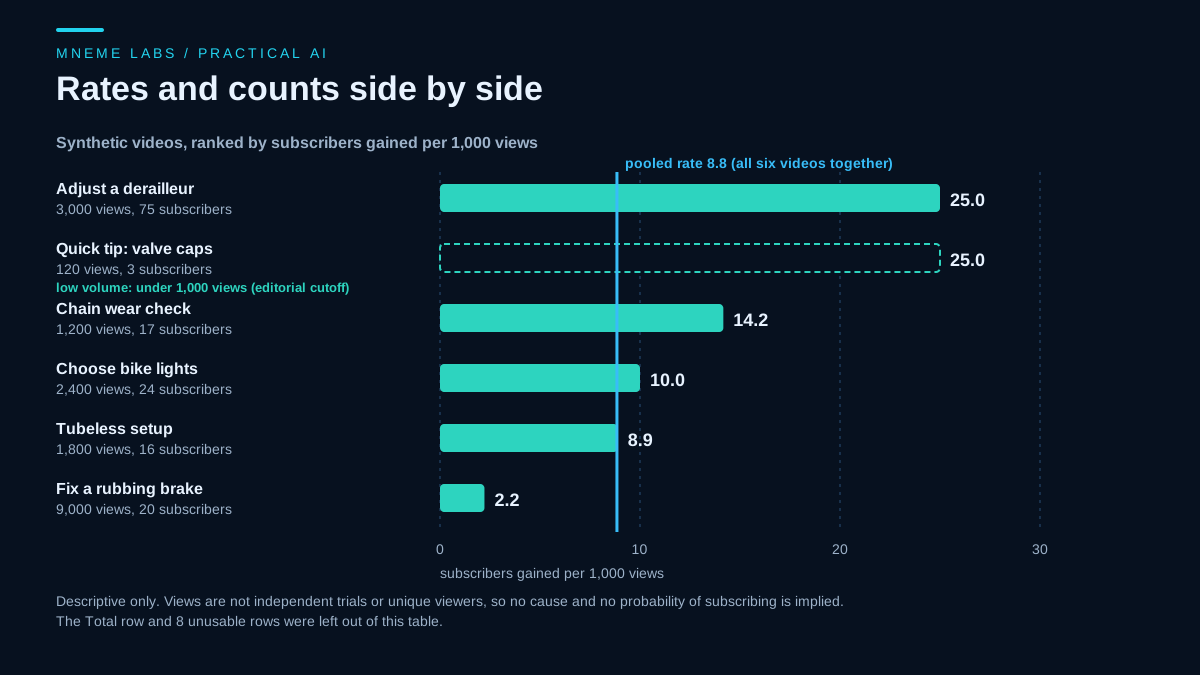
Adjust a derailleur          3,000 views    75 subs   25.0 per 1k  +16.2 vs pooled
Quick tip: valve caps          120 views     3 subs   25.0 per 1k  +16.2 vs pooled  low volume (editorial cutoff: under 1,000 views)
Chain wear check             1,200 views    17 subs   14.2 per 1k   +5.3 vs pooled
Choose bike lights           2,400 views    24 subs   10.0 per 1k   +1.2 vs pooled
Tubeless setup               1,800 views    16 subs    8.9 per 1k   +0.0 vs pooled
Fix a rubbing brake          9,000 views    20 subs    2.2 per 1k   -6.6 vs pooled
skipped data row 8 (Draft video): missing value
skipped data row 9 (Unlisted test): zero views
skipped data row 10 (Short with NaN): views: not a plain number 'NaN'
skipped data row 11 (Short with Infinity): views: not a plain number 'Infinity'
skipped data row 12 (Half counted): subscribers: fractional count 7.5
skipped data row 13 (Mistyped counts): more subscribers than views
skipped data row 14 (Negative gain): subscribers: negative count -3
skipped data row 15 (Abbreviated views): views: not a plain number '1.2K'
The Total row was excluded, so the six videos add up to 17,520 views and 155 subscribers gained, not double those figures. The pooled rate is 8.8 subscribers per 1,000 views. The derailleur video had 75 subscribers from 3,000 views, which is 25.0 per 1,000. The brake video had 20 subscribers from 9,000 views, which is 2.2 per 1,000. The valve caps tip also came to 25.0, but from 120 views and 3 subscribers, so it is marked low volume. One subscriber more or less would move that rate by 8.3 per 1,000 views. The same change on the derailleur video would move its rate by 0.3.
Those numbers describe an invented channel. They show how the method behaves. They say nothing about what your numbers will look like, and nothing here explains why one video's rate is higher than another's. Alongside this run, 77 small checks covered the parsing rules above, a Total row in the first column, an unlabeled Total row, zero subscribers, a zero view table, a missing column, and unreadable files. The code shown here is the code that was tested.
Turn a finding into a test, not a conclusion
A video with a higher rate gives you a hypothesis, not a formula. In the synthetic example, the derailleur video might have a higher rate because it solves a more painful problem, because its viewers arrived by search with a clear need, or because the ending points to a related video. Each is plausible and the data cannot separate them. The practical steps are modest:
- List what the high-rate videos have in common that you can control: topic, format, length, how the video ends, and where viewers came from.
- Pick one of those traits and apply it to the next video, changing as little else as you can.
- Wait until each video has reached the view count you chose in advance, then compare again with the same script and read the rates next to the counts.
An AI assistant is useful at step 1 and for drafting alternatives. A prompt along these lines works, as plain text:
Here are anonymized rows from my channel analytics: title, views, subscribers
gained, and the traffic source. List three possible reasons the top rows may have a higher subscribers-per-view
rate than the bottom rows. For each reason, give one cheap test I
can run on my next video. Do not claim any reason is confirmed.

[paste rows]
Treat the answer as brainstorming. A model that sees ten rows will happily explain them, whether or not the explanation is true. A rate that differs between two videos does not show which trait caused it.
What the 1,000 subscriber mark does and does not mean
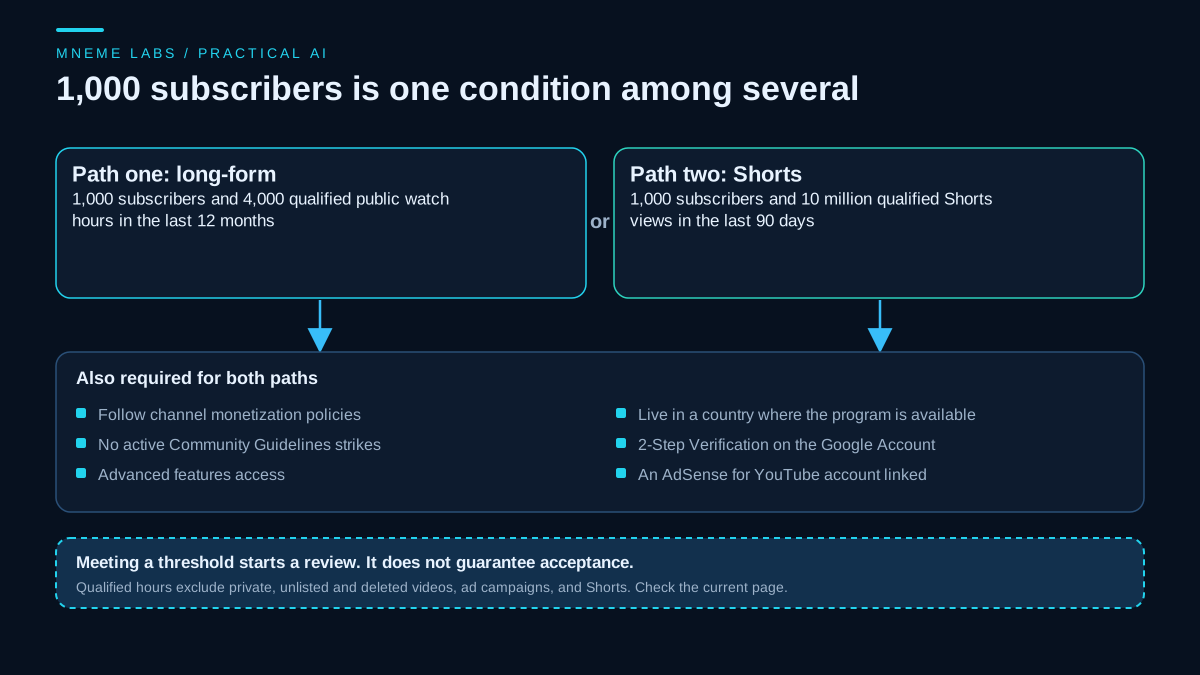
Many creators chase 1,000 because of the YouTube Partner Program. The program's eligibility page lists two ways a channel can become eligible. One is 1,000 subscribers with 4,000 qualified watch hours in the last 12 months. The other is 1,000 subscribers with 10 million qualified Shorts views in the last 90 days. That page was opened for this update on November 15, 2026, and these are the numbers it showed that day.
The page's terms are specific. It says "qualified watch hours" and "qualified Shorts views". Some older guides say "valid public watch hours", a phrase that does not appear on the current page. Qualified watch hours are those gained from long-form videos you have set public. Private videos, unlisted videos, deleted videos, ad campaigns, and Shorts do not count, and neither do livestreams that are unlisted, deleted, or not converted to video on demand. The page adds that watch hours from Shorts views in the Shorts feed do not count toward the 4,000. Qualified Shorts views are views of public Shorts that appear in the Shorts feed. Views of private, unlisted, or deleted Shorts, ad campaigns, and image posts that appear in the Shorts feed do not count.
Subscribers alone are therefore not enough. The page also lists requirements for joining: following the channel monetization policies, living in a country or region where the program is available, having no active Community Guidelines strikes, turning on 2-Step Verification for the Google Account, having access to advanced features, and having one active AdSense for YouTube account linked, or being ready to set one up in YouTube Studio.
Meeting a threshold does not mean acceptance. The page says every channel that meets one goes through a standard review of the channel as a whole, by automated systems and human reviewers, with a decision typically in about one month and delays possible. After an unsuccessful application, the page says you can appeal within 21 days, or keep uploading original content and apply again after 30 days, or after 90 days if it is not your first rejected application. It also says that if your counts drop below the threshold after you apply, the review still goes ahead.
Earlier access is a separate matter. Under "Where to apply", the page shows a link titled "Earlier Access to YouTube Partner Program Features". The page text does not state thresholds for it, so this guide gives none, and the two thresholds above are the only ones the eligibility section lists. Read the current page before you plan around any number, because YouTube changes these programs over time.
For a plan, this means watching three things together: subscribers, qualified watch hours or qualified Shorts views, and policy compliance. A channel with many subscribers and few qualified watch hours has not met the first threshold, and the reverse is also true.
What not to do
- Buying or trading subscribers. A subscriber who never watches adds to a number and nothing else, and the review of a channel looks at what the channel actually publishes. Do not take shortcuts that create a gap between your count and your real audience.
- Misleading titles to chase impressions. The impressions FAQ warns against clickbait, noting that it tends to produce high click-through with low average view duration, and so fewer recommendations.
- Asking for a subscription with no reason. A prompt without a reason to subscribe is easy to skip. Tell viewers what the next video will cover and why it is worth the follow.
- Mass-produced content. YouTube's channel monetization policies say monetized content should be original and not mass-produced, generic, or repetitive, and that reviewers may look at your main theme, most viewed videos, newest videos, and metadata. AI-assisted production is fine, but identical template videos are a risk for monetization.
- Daily metric checking. Retention and click-through data need time and volume. Check on a schedule, such as weekly, and avoid reacting to a single day.
A worked example
Take the synthetic table above as a stand-in for a bike repair channel. Its owner exports views and subscribers gained per video, runs the script with the default 1,000 view cutoff, and reads the output. The derailleur and chain wear videos show 25.0 and 14.2 subscribers per 1,000 views, the brake video shows 2.2, and the 120 view valve caps tip is marked low volume. Suppose the owner notices that the derailleur and chain wear videos both end with a link to a related repair, and the brake video does not. That suggests a hypothesis, not a rule: tutorials that end with a specific next step may gain more subscribers per view. The next two tutorials get that ending, the owner reruns the script in a month, and compares the rates together with the counts. If the rates do not move, the hypothesis may be wrong, or the views may be too few to show a change, and either answer is useful. If the rates do rise, the ending is still not shown to be the cause, because topic, traffic source, and timing changed as well.
Limits
- Subscriber counts are a lagging, noisy signal. A video can help a channel without a visible jump in subscribers.
- The script compares your own videos with each other. It cannot tell you whether a rate is good against other channels.
- The rates describe past counts. They do not estimate the chance that a future viewer subscribes, and they do not show why one video did better.
- Low volume is an editorial cutoff you set. Counts above it are still affected by chance, topic, and traffic source.
- YouTube's reports and thresholds change, as the pages above show. Always check the current Help text.
- Reaching 1,000 subscribers is a milestone for a program, not a measure of whether your videos are useful to viewers.
A next step
Export one table of your videos, run the script with a minimum view count that matches your channel's size, and write down one trait to test. If you do not have 1,000 views on most videos yet, most rows will be marked low volume, and the better use of this month is publishing and improving the first 30 seconds of each video, using the retention report to guide the script.
Sources
- YouTube Help, Understand your YouTube content performance: the Subscribers report by content type, what "others" includes, views definition.
- YouTube Help, Impressions and click-through-rate FAQs: click-through-rate scope, cautions against small samples, small changes and multi-thumbnail testing, and the clickbait warning.
- YouTube Help, Learn how to use Advanced Mode for analytics reports: comparing, filtering by subscription status, and exporting.
- YouTube Help, YouTube Partner Program overview and eligibility: the two eligibility thresholds, the definitions of qualified watch hours and qualified Shorts views, other requirements, review process, timing and reapplication periods, and the Earlier Access link (opened November 15, 2026).
- YouTube Help, YouTube channel monetization policies: originality expectations and what reviewers look at.