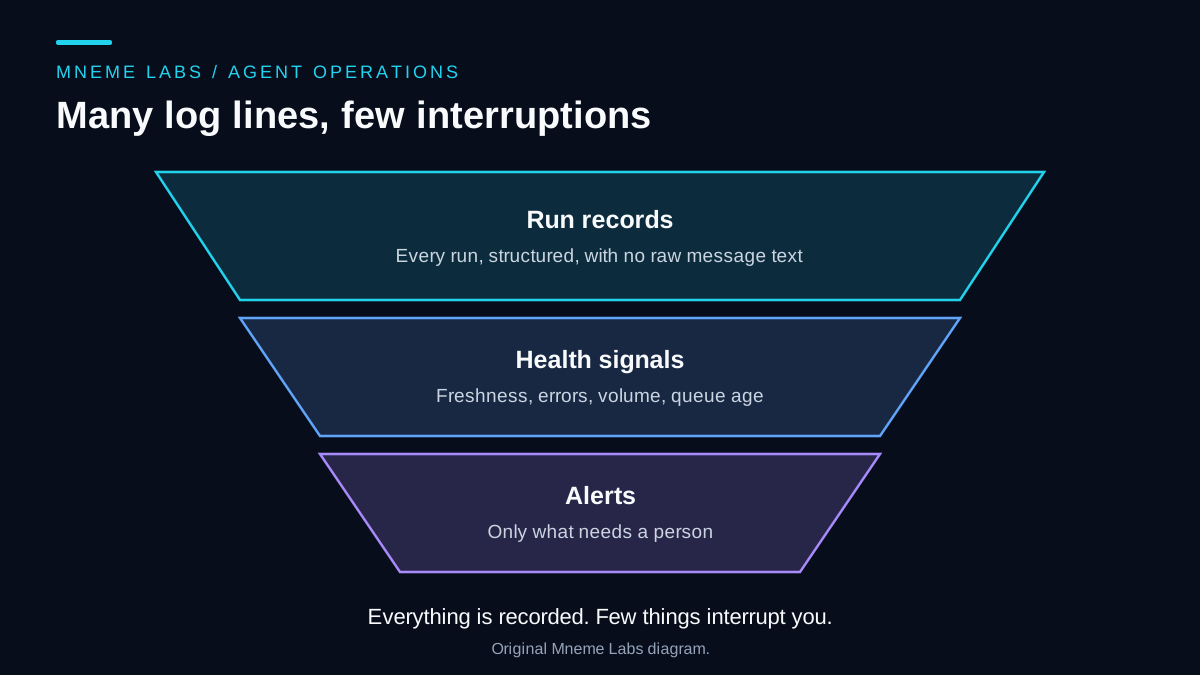
A scheduled agent can fail without anyone noticing. It runs on time and reads nothing. Its login expires and the job exits quietly. Drafts accumulate in a review queue that nobody opens. Monitoring exists to answer three questions: did the agent run, did it do something sensible, and does anything need a person right now?
This guide is about visibility. It is separate from the retry guide, which covers how an agent recovers from a failure. It reports no measured results from any deployment. The record format, signals, and alert rules below are a design you can adapt and test on your own system.
Write one structured record per run
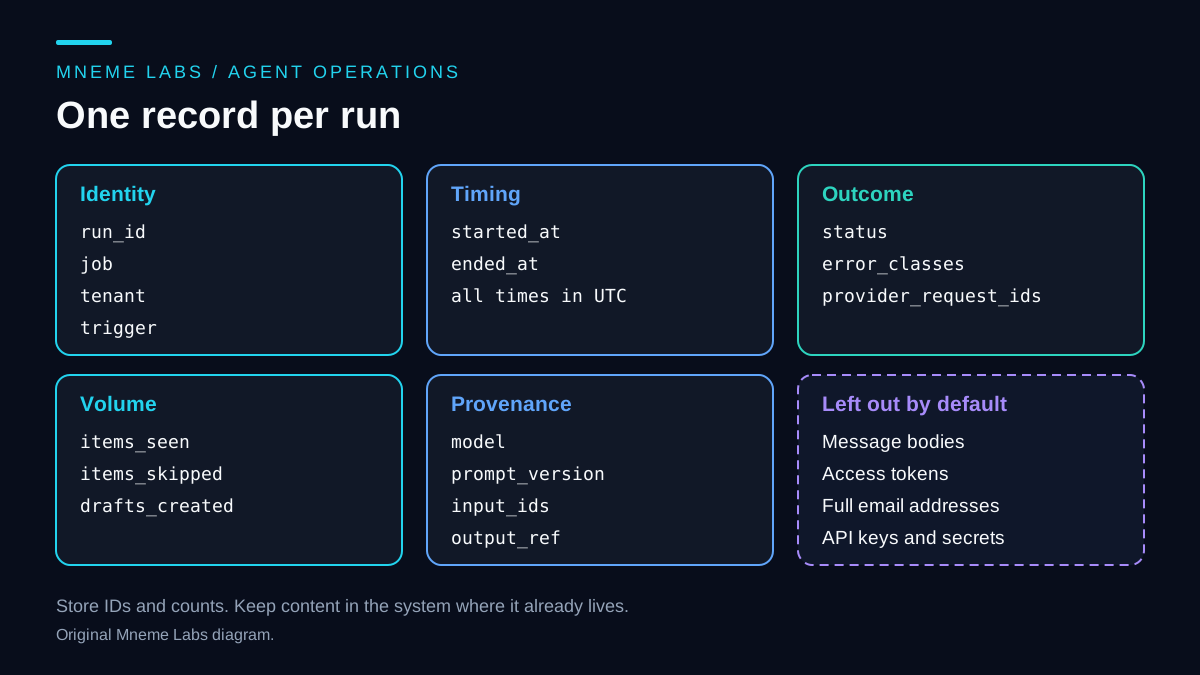
Start with a single line of structured data at the end of every run, whether it succeeded or failed. The OWASP Logging Cheat Sheet says each log entry should capture when, where, who, and what, and recommends an interaction identifier that links every event belonging to one interaction. A run_id plays that role for an agent. Give every step in a run the same run_id and you can reassemble what happened later.
The figure groups fields by purpose. Here is one illustrative record, formatted across lines for readability. In a JSON Lines file, serialize each whole record on one line:
{
  "run_id": "2026-11-15T13:00Z-inbox-triage-a1b2",
  "job": "inbox_triage",
  "tenant": "shop_main",
  "trigger": "schedule",
  "started_at": "2026-11-15T13:00:02Z",
  "ended_at": "2026-11-15T13:00:41Z",
  "status": "completed_with_skips",
  "items_seen": 12,
  "items_skipped": 2,
  "drafts_created": 10,
  "error_classes": {"transient": 1},
  "provider_request_ids": ["req_example"],
  "model": "model-id-from-config",
  "prompt_version": "triage-v3",
  "input_ids": ["msg_01", "msg_02"],
  "output_ref": "queue/2026-11-15/13",
  "review_state": "pending"
}
Keep timestamps in UTC and format them the same way everywhere. Record the provider's request ID when the API returns one. Anthropic's error reference, for example, includes a request_id in error responses so that a support team can trace a specific call. If you later adopt OpenTelemetry, you will find the idea familiar: its traces documentation describes a span as a unit of work with a name, timestamps, attributes, and status, and notes that spans resemble structured logs with correlation and hierarchy added. You do not need that tooling to begin. A run record that shares an ID across steps is a useful starting point for a small agent; it does not replace cross-service traces.
Log identifiers and counts, not content
The OWASP cheat sheet lists data that should usually not appear in logs directly and should instead be removed, masked, hashed, or encrypted. The list includes access tokens, session identifiers, passwords, connection strings, encryption keys, payment data, and sensitive personal data. It treats names, phone numbers, and email addresses as data that may need special handling before they are recorded. It also advises keeping logs out of web-accessible locations and restricting file permissions.
For an agent that reads email or customer messages, that translates to a plain default: store message IDs and counts, and leave the message text in the system where it already lives. If a bug can only be diagnosed with content, make capture an explicit switch for one run, with a short retention period and limited access. The last panel in the figure above lists the fields this default leaves out. The security guide covers the broader exposure risks.
Watch five signals
Google's SRE book chapter on monitoring distributed systems says that if you can only measure four things, measure latency, traffic, errors, and saturation. An agent maps onto that list with one addition.
- Freshness. How long since the last successful run, compared with how often it should run? This catches an agent that stopped without saying anything.
- Error mix. Count errors by class: transient, permanent, needs a person, and unknown. The SRE chapter notes that errors include implicit failures, such as a successful response carrying the wrong content. Your own validators, such as a schema check or a banned-phrase check, are how an agent notices those.
- Volume. How many items did the run see? Zero is sometimes correct, but zero for many runs in a row, or a sudden spike, deserves a look. Decide what counts as unusual from a baseline you have actually observed.
- Queue age. The SRE chapter defines saturation as how full a system is. For an agent that feeds human review, the review queue is what fills up. Track the age of the oldest unreviewed item and the number waiting.
- Output validity. How many drafts fail validation, and why do reviewers reject the ones they do? Rejection reasons tell you more than a pass rate.
Run duration is the latency signal, and cost per run, computed from the usage figures your provider reports, belongs on a weekly view. None of these needs a dashboard to start. A script that reads the run log is enough.
Check from outside the agent
A job that has crashed cannot report that it crashed. Put the freshness check in a separate small script, on a separate schedule, that reads the run log and notifies you if no successful record has appeared within about two intervals. This is the same idea as a dead-man's switch.
import json
import pathlib
from datetime import datetime, timedelta, timezone


def last_success(log_path, job):
    best = None
    for line in pathlib.Path(log_path).read_text(encoding="utf-8").splitlines():
        if not line.strip():
            continue
        rec = json.loads(line)
        if rec["job"] != job or rec["status"] not in {"completed", "completed_with_skips"}:
            continue
        ended = datetime.fromisoformat(rec["ended_at"].replace("Z", "+00:00"))
        if ended.tzinfo is None:
            raise ValueError("run timestamps must include a time zone")
        best = ended if best is None else max(best, ended)
    return best


def is_stale(log_path, job, interval_minutes, now=None):
    """True means stale or monitoring data needs investigation."""
    if interval_minutes <= 0:
        raise ValueError("interval_minutes must be positive")
    now = now or datetime.now(timezone.utc)
    try:
        last = last_success(log_path, job)
    except (OSError, ValueError, KeyError, TypeError):
        return True  # a missing or corrupt log must not look healthy
    return last is None or last > now or now - last > timedelta(minutes=2 * interval_minutes)
This is a sketch, not a tested package. It reads the whole file each time, which is fine for a small log and wasteful for a large one. If the monitor and the agent run on the same machine, a power loss takes both down, so for anything important run the check somewhere else.
Decide which signals interrupt you
The SRE chapter recommends actionable alerts tied to user-visible symptoms, with separate channels for urgent and less urgent findings. Apply that distinction to the work your agent is supposed to deliver. For an agent, the symptom is "nothing reached the queue." The cause, such as an auth error or a changed API response, goes in the run record's error fields.
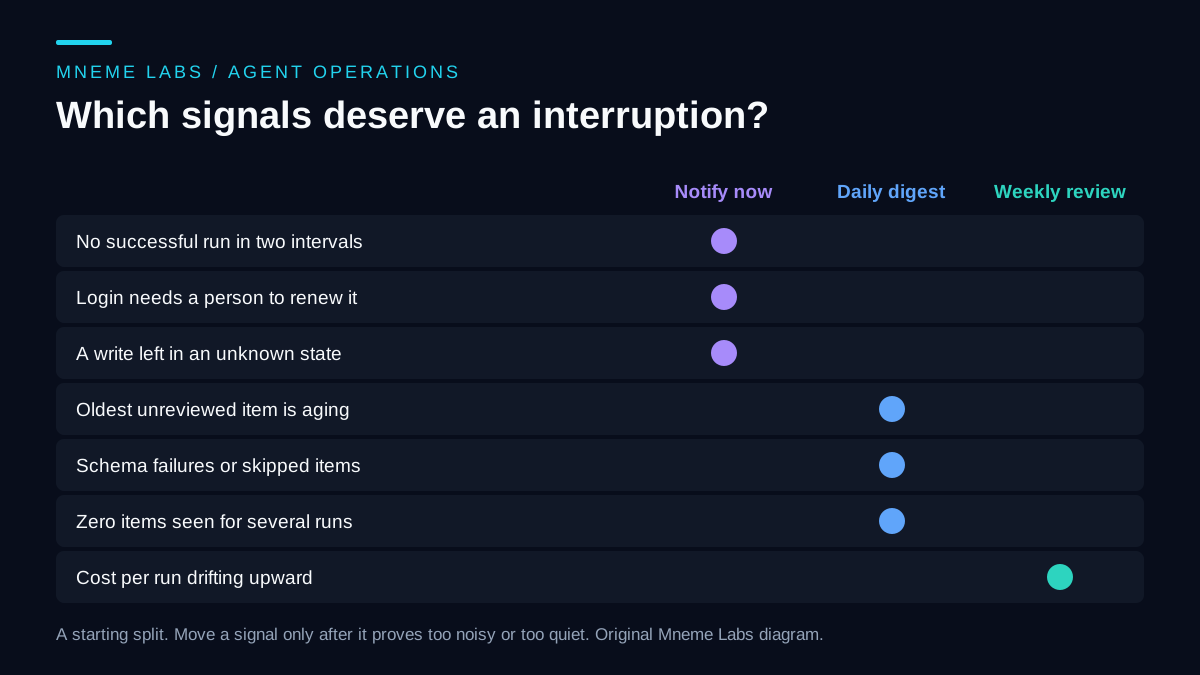
A workable starting split, shown above:
- Notify now for clear failures: no successful run within about two intervals, a login that needs a person to renew it, and a write left in an unknown state.
- Daily digest for conditions that matter but can wait: the age of the oldest unreviewed item, skipped items and validation failures, and a streak of zero-item runs.
- Weekly review for slow movement: cost per run drifting up, reviewer rejection reasons, and retry counts trending upward.
The SRE chapter also recommends removing collected signals that no dashboard or alert uses, and alert rules that rarely fire. Review your rules every few weeks and drop what you never act on.
A short routine you will keep doing
Each day, read the digest and open the oldest item in the review queue. Each week, pull five approved items at random and compare them with their sources. Scan the rejected items for a pattern, such as one input type that keeps producing bad drafts. Check whether each alert that fired was worth the interruption. If the routine takes long enough that you start skipping it, remove a signal.
What monitoring cannot tell you
Logs show that the agent ran and what it counted. They do not show whether a plausible draft was wrong. Only sampling against sources catches that. Monitoring also adds work of its own: schemas drift, scripts break, and a noisy alert gets muted. Match the effort to the stakes. A single worker that drafts notes needs a run record, a freshness check, and a queue-age line. A system that touches money or customers needs stricter controls and a person who owns them.
First steps
Add the run record to one existing job, then write the freshness check. Add queue age to a daily digest. Only after a few weeks of using those should you consider more. To see a concrete job that benefits, read the read-only Gmail polling design. Then exercise the retry policy against fake failures and verify that exhausted attempts appear in the digest. Monitoring is useful only when it leads to a clear next action.
Sources
- Google SRE Book, Monitoring Distributed Systems: the four golden signals, symptoms versus causes, alert fatigue, and removing unused signals.
- OWASP, Logging Cheat Sheet: when, where, who, and what; interaction identifiers; data to exclude or mask.
- OpenTelemetry, Traces: spans as units of work resembling structured logs with correlation.
- Anthropic, Claude API errors: request IDs in error responses.