An assistant given a spreadsheet will usually produce a confident explanation of it. That is the risk. A fluent paragraph about conversion rates can be wrong in ways the paragraph itself never shows: the data had duplicates, the groups were not comparable, or the sample was too small to say anything.
The fix is an ordering rule. Calculate first, in code you can rerun, and write the explanation last, from the calculated numbers. This guide builds that workflow in Python's standard library and runs it on invented data. It makes no claim about how long analysis takes, and the figures in the examples are not measurements of any real site. They are small tables made up to show specific traps.
Know what each count measures
Before any arithmetic, know what the columns mean. Google's Search Console help defines its performance metrics precisely. Impressions are how often someone saw a link to your site. Clicks are how often someone clicked a link from Google to your site. Click-through rate is clicks divided by impressions. The same page says data is attributed to the canonical URL of a link, and that the heuristics it describes, such as what counts as an impression, are subject to change.
Those are Google's counts, collected by Google. Your own analytics tool counts visits or sessions by its own rules, and a checkout system counts orders. These are different systems with different definitions, so their numbers will not match, and a mismatch is not by itself an error. An analysis that divides one tool's count by another's needs a stated reason. Write the definition of every column next to its name before you compute anything.
Step 1: validate the table
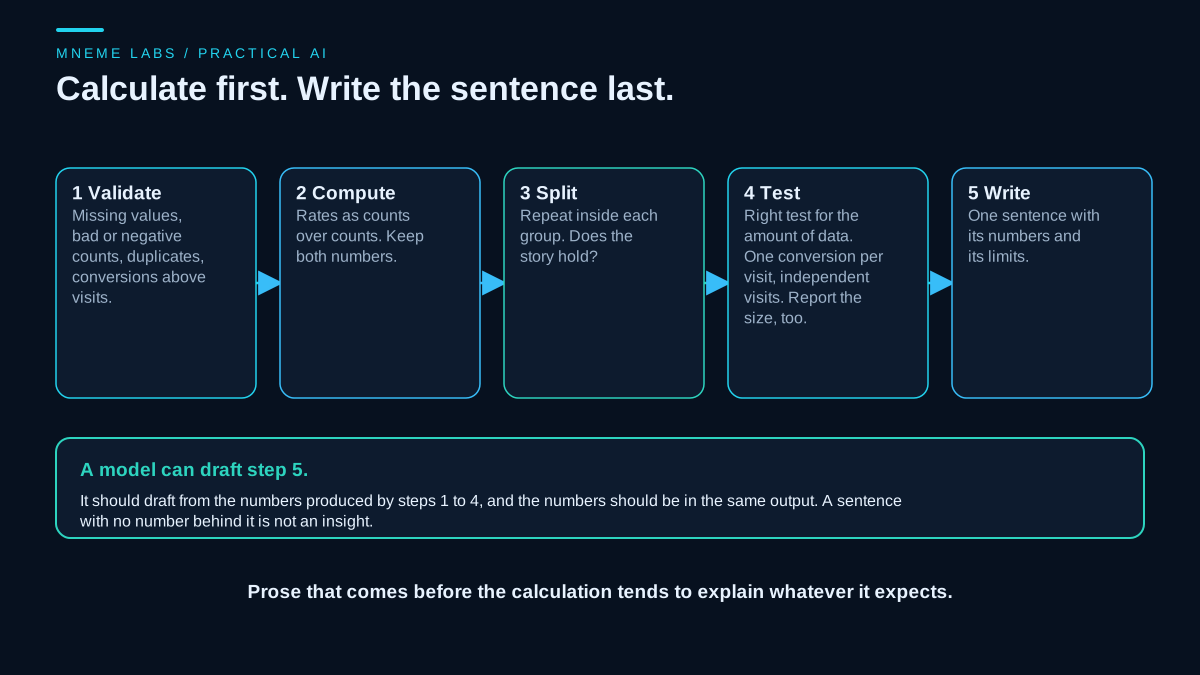
Most bad analyses start with a bad table. The checks are plain: required fields present, each count a finite, nonnegative whole number, conversions not larger than visits, and no duplicate rows for the same date, variant and device. The checker returns row numbers, so a person can fix the source.
Counts need extra care when they come from a CSV file. A reader such as csv.DictReader returns every value as text, so "150" and "100" are strings, and a check written only for numbers would skip them without a message. The parse_count function in the first code block below converts first and judges second. It rejects true and false values, NaN, Infinity, fractions such as 12.5, negatives, blanks, thousands separators such as 1,000 and exponents such as 1e3, and it names the reason. It accepts 150.0, because that is a whole number. The comparison of conversions with visits happens after parsing, on whole numbers.
Step 2 and 3: compute rates, then split
A rate is two numbers, not one. Always keep the count and the total together, because "8.2 percent" with no denominator hides whether it came from 82 of 1,000 or 1 of 12. After computing the overall rate, compute it again inside each group that might matter, such as device, channel or date range.
This second pass catches a trap the Stanford Encyclopedia of Philosophy describes in its entry on Simpson's paradox: an association in a whole population can reverse inside every subpopulation. The entry notes that understanding the paradox is essential for drawing proper conclusions from data and discusses its place in causal reasoning. It is not a rare curiosity, and it is not automatic either. It can appear when the two things being compared have a different mix of groups and the groups have different baselines. If both variants had the same mix, a total could not point the opposite way from every group. So the habit is to check the rate inside each group.
The first code block covers steps 1 to 3: parsing counts, validating the table and grouping it. group refuses a table that validate rejects, so a bad row cannot slip into a total.
import math
import re
from decimal import Decimal


def parse_count(value):
    """Return (count, None) for a finite, nonnegative whole number, or (None, reason).
    Accepts int, float and plain CSV text such as "150" or "150.0". Rejects true/false, NaN,
    Infinity, fractions, negatives, blanks, thousands separators and exponents."""
    if isinstance(value, bool):
        return None, "is true or false, not a count"
    if isinstance(value, int):
        n = Decimal(value)
    elif isinstance(value, float):
        if not math.isfinite(value):
            return None, "is not finite"
        n = Decimal(value)
    elif isinstance(value, str):
        s = value.strip()
        if not s:
            return None, "is missing"
        if s.lstrip("+-").lower() in ("nan", "inf", "infinity"):
            return None, "is not finite"
        if not re.fullmatch(r"[+-]?(\d+(\.\d*)?|\.\d+)", s, re.ASCII):
            return None, "is not a plain number"
        n = Decimal(s)
    elif value is None:
        return None, "is missing"
    else:
        return None, "is not a number"
    if n < 0:
        return None, "is negative"
    if n != n.to_integral_value():
        return None, "is not a whole number"
    return int(n), None


def blank(v):
    return v is None or not str(v).strip()


def validate(rows):
    """Return a list of (row_number, problem). Row numbers start at 1. Counts may be numbers or CSV text."""
    problems, seen = [], set()
    for i, r in enumerate(rows, 1):
        for k in ("date", "variant", "device"):
            if blank(r.get(k)):
                problems.append((i, "missing " + k))
        counts = {}
        for k in ("visits", "conversions"):
            n, why = parse_count(r.get(k))
            if why:
                problems.append((i, "%s %s" % (k, why)))
            else:
                counts[k] = n
        if len(counts) == 2 and counts["conversions"] > counts["visits"]:   # compared after parsing, so "150" > "100" is caught
            problems.append((i, "conversions exceed visits"))
        key = tuple(str(r.get(k, "")).strip() for k in ("date", "variant", "device"))
        if key in seen:
            problems.append((i, "duplicate row"))
        seen.add(key)
    return problems


def rate(x, n):
    return x / n if n else float("nan")


def group(rows, keys):
    """Sum (conversions, visits) per group. Refuses any table that validate() rejects."""
    problems = validate(rows)
    if problems:
        raise ValueError("table failed validation, first problems: %r" % (problems[:5],))
    out = {}
    for r in rows:
        k = tuple(str(r[x]).strip() for x in keys)
        x, n = out.get(k, (0, 0))
        out[k] = (x + parse_count(r["conversions"])[0], n + parse_count(r["visits"])[0])
    return out
Step 4: test with the amount of data in mind
When a difference looks real, ask how likely it would be to see a gap that size from chance alone. NIST's engineering statistics handbook gives two standard tools for comparing the proportions in two groups. For reasonably large samples, a z statistic built on the normal approximation to the binomial compares the pooled proportion to the difference. For small counts, Fisher's exact test computes the probability directly from the hypergeometric distribution, using a two by two table of frequencies. The cutoff between "large" and "small" here is a common rule of thumb, an expected count below five in any cell, and it is an assumption of this guide and not a statement taken from NIST.
A p-value is a measure of surprise under one assumption, that the two groups share the same underlying rate. It is not the probability that you are right, and 0.05 is a convention, not a boundary of nature. The code reports the p-value and the size of the difference, and when the p-value is not small it says "inconclusive" and not "no difference."
Both tests treat each visit as one independent yes or no trial. That is two requirements on the data. A visit converts at most once, so conversions can never exceed visits. And visits are independent observations, so the same person returning many times, or visits that influence each other, break the assumption. When either fails, for example when the conversions column counts orders and one visit can place two, or when one visitor is counted again and again, the z test and Fisher's test are inappropriate and their p-values should not be reported. Count unique visitors first, or use a method built for repeated measures. The functions below also refuse input that cannot be a pair of proportions: a group with no visits, a negative or fractional count, a non-finite value, true or false, or more conversions than visits.
def check_counts(x1, n1, x2, n2):
    """Return the four counts as ints or raise ValueError. Needs 0 <= x <= n and n > 0 in both groups."""
    out = []
    for name, v in (("x1", x1), ("n1", n1), ("x2", x2), ("n2", n2)):
        n, why = parse_count(v)
        if why:
            raise ValueError("%s %s" % (name, why))
        out.append(n)
    x1, n1, x2, n2 = out
    if n1 <= 0 or n2 <= 0:
        raise ValueError("each group needs at least one visit")
    if x1 > n1 or x2 > n2:
        raise ValueError("conversions exceed visits")
    return x1, n1, x2, n2


def z_two_proportions(x1, n1, x2, n2):
    x1, n1, x2, n2 = check_counts(x1, n1, x2, n2)
    p1, p2 = x1 / n1, x2 / n2
    p = (x1 + x2) / (n1 + n2)
    se = math.sqrt(p * (1 - p) * (1 / n1 + 1 / n2))
    z = 0.0 if se == 0 else (p1 - p2) / se
    return z, math.erfc(abs(z) / math.sqrt(2))                  # two-sided p from the normal distribution


def _hyper(a, row1, col1, n):
    return math.comb(col1, a) * math.comb(n - col1, row1 - a) / math.comb(n, row1)


def fisher(a, b, c, d, two_sided=True):
    """2x2 table [[a, b], [c, d]]. Exact p-value from the hypergeometric distribution."""
    counts = []
    for name, v in zip("abcd", (a, b, c, d)):
        n, why = parse_count(v)
        if why:
            raise ValueError("%s %s" % (name, why))
        counts.append(n)
    a, b, c, d = counts
    if a + b == 0 or c + d == 0:
        raise ValueError("each row of the table needs at least one observation")
    row1, col1, n = a + b, a + c, a + b + c + d
    lo, hi = max(0, row1 + col1 - n), min(row1, col1)
    p_obs = _hyper(a, row1, col1, n)
    if two_sided:
        return sum(p for p in (_hyper(k, row1, col1, n) for k in range(lo, hi + 1)) if p <= p_obs + 1e-12)
    expected = row1 * col1 / n
    ks = range(a, hi + 1) if a >= expected else range(lo, a + 1)
    return sum(_hyper(k, row1, col1, n) for k in ks)


def min_expected(x1, n1, x2, n2):
    x1, n1, x2, n2 = check_counts(x1, n1, x2, n2)
    tot_x, tot_n = x1 + x2, n1 + n2
    return min(n1 * tot_x / tot_n, n1 * (tot_n - tot_x) / tot_n, n2 * tot_x / tot_n, n2 * (tot_n - tot_x) / tot_n)


def compare(x1, n1, x2, n2, alpha=0.05):
    """Plain-words comparison of two proportions. alpha is a convention, not a law."""
    x1, n1, x2, n2 = check_counts(x1, n1, x2, n2)
    small = min_expected(x1, n1, x2, n2) < 5
    p = fisher(x1, n1 - x1, x2, n2 - x2) if small else z_two_proportions(x1, n1, x2, n2)[1]
    method = "fisher exact" if small else "z test"
    word = "inconclusive" if p >= alpha else "difference unlikely to be chance alone"
    return {"rates": (x1 / n1, x2 / n2), "diff": x1 / n1 - x2 / n2, "p": p, "method": method, "reading": word}


def compare_groups(rows, split="device", a="A", b="B"):
    """Variant a against variant b overall and inside each value of `split`, each with its own test.
    The overall p-value mixes the groups, so read the within-group entries before it."""
    overall, inside = group(rows, ["variant"]), group(rows, ["variant", split])
    out = {"overall": compare(*overall[(a,)], *overall[(b,)]), "within": {}}
    for v in sorted({k[1] for k in inside}):
        if (a, v) not in inside or (b, v) not in inside:
            raise ValueError("group %r is missing variant %s or %s" % (v, a, b))
        out["within"][v] = compare(*inside[(a, v)], *inside[(b, v)])
    flip = lambda d: d * out["overall"]["diff"] < 0
    out["every_group_points_the_other_way"] = all(flip(r["diff"]) for r in out["within"].values())
    return out
compare_groups runs the same comparison overall and inside each device, which is what the examples below use. Its overall p-value mixes the groups, so read the within-group entries first.
What the tests showed
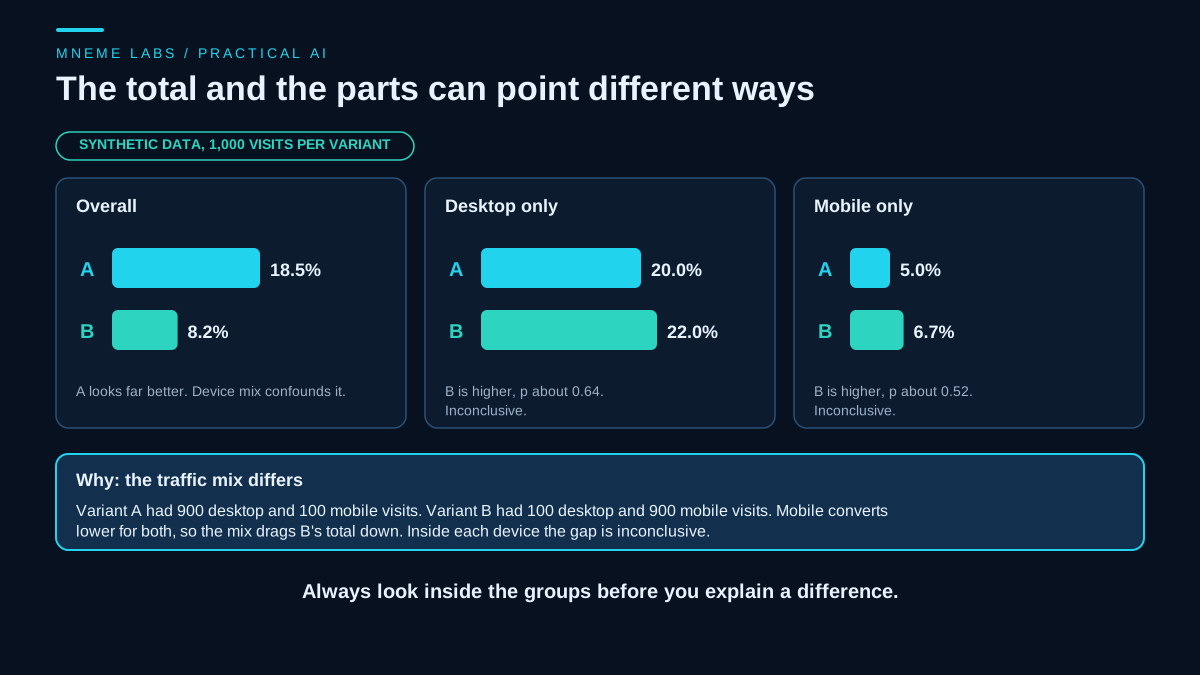
The synthetic data described two page variants, A and B, with 1,000 visits each, split across two days and two device types. Variant A had 900 desktop visits and 100 mobile visits. Variant B had the reverse.
The validator caught the faults seeded into a copy of the table: a duplicate row, a row with more conversions than visits, a missing device and a negative visit count, each with its row number. The table was also written out as CSV text and read back with csv.DictReader, so every count was a string. It validated clean, and a row reading 100 visits and 150 conversions was flagged as conversions above visits. Other inputs were rejected with a named reason: true, NaN, Infinity, 12.5, "100.5", "1,000", "1e3", a blank and a missing field. group refused to total any of those tables, and it summed the clean CSV rows as numbers and not as joined text.
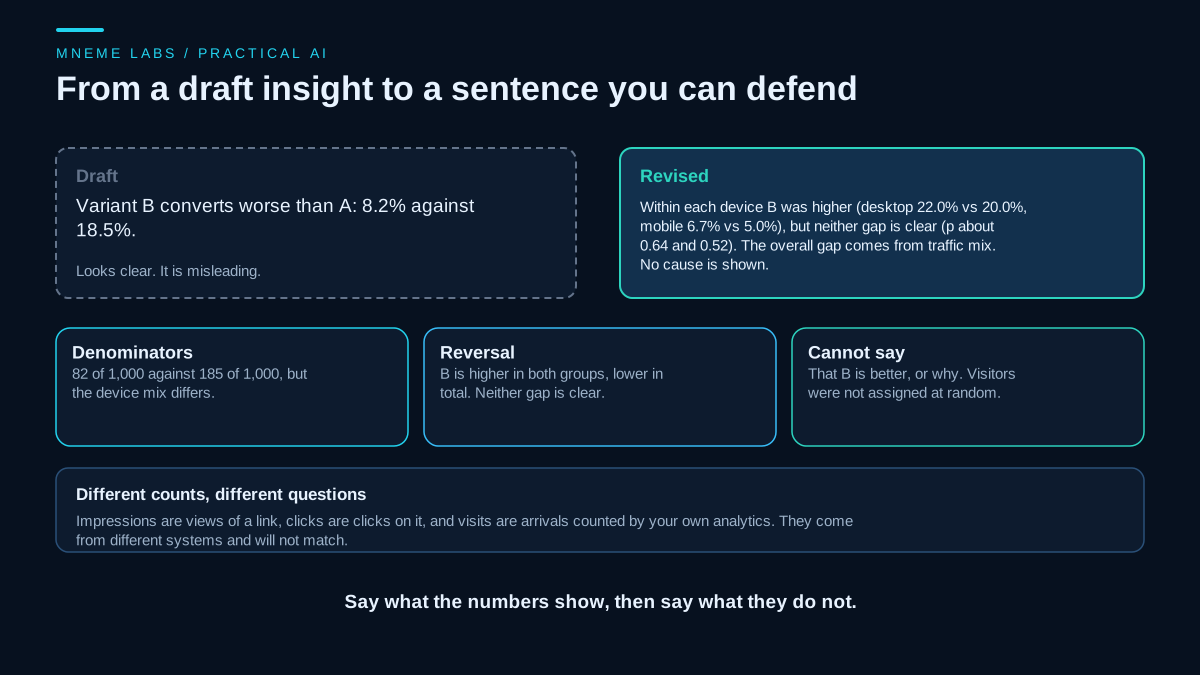
On the clean table, A converted 185 of 1,000 visits, 18.5 percent, and B converted 82 of 1,000, 8.2 percent. Looked at inside devices, the pattern reversed. On desktop, A was at 20.0 percent and B at 22.0. On mobile, A was at 5.0 percent and B at 6.7. B's rate was higher in both groups and lower in total, because most of B's traffic was on the device that converts less.
Higher is not the same as better. Run through the same z test, the desktop difference, 180 of 900 against 22 of 100, gives a p-value of about 0.64. The mobile difference, 5 of 100 against 60 of 900, gives about 0.52. Neither can be told apart from chance, so the data show no evidence that B is better in either group. They show only that the overall gap comes from traffic mix.
The test code was checked against hand calculations. Two identical proportions gave a z statistic of zero and a p-value of one. For the pooled difference between 185 of 1,000 and 82 of 1,000, the z value matched a hand computation, and the p-value was about one in eighty billion. That number answers a narrow question, whether the two overall rates differ, and device mix confounds it, because the variants drew very different shares of mobile traffic. It does not show that A is the better page. The within-device results above are the ones that bear on that question. For Fisher's exact test, the table in NIST's worked example, with 2 and 5 in the first row and 3 and 2 in the second, gave a one-sided probability that matched the hand sum of the three possible tables, 246 over 792, about 0.31, and the probabilities of all possible tables added to one. The functions also refused input that cannot be a pair of proportions: a group with no visits, negative or fractional counts, true or false, NaN, Infinity and conversions above visits. Strings such as "185" and "1000" were accepted and gave the same answer as numbers.
The sample-size lesson came from two more cases. With 3 conversions out of 20 against 1 out of 20, the code chose Fisher's test, returned a p-value of about 0.6, and called the result inconclusive. With the same 18 percent against 8 percent rates on 100 visits each instead of 1,000, the p-value was about 0.036, borderline by the usual convention, where on 1,000 visits it had been vanishingly small. The rates did not change. The amount of evidence did.
None of this tests whether a model writes good explanations, whether your real data is as tidy as this, or whether your groups were assigned fairly.
Where the model fits
Give the model the outputs, not the table. Ask it to draft one sentence from the validated numbers, the group results and the test result, and require every number in the sentence to appear in that output. Do not ask it to do the arithmetic. Models make arithmetic and counting mistakes, and a script does not. OWASP's guidance on misinformation lists cross-verification, human oversight and automatic validation as mitigations for plausible but wrong output, and a deterministic check of each number in the draft is a direct form of the last one. Keep private customer data out of prompts unless you have decided it may leave your systems.
Failure cases
Association is not cause, and a small gap is not a result. B's higher rates inside each device are inconclusive here, and even a clear gap would not show that B caused it unless visitors were assigned at random. Say so in the sentence.
Repeated visitors and multiple conversions. If one person can appear many times, or one visit can convert twice, the proportions tests do not apply. Count unique visitors first.
Many slices. Split enough ways and some slice will look striking by chance. Decide which splits matter before you look, and report how many you tried.
Averaging rates. The average of daily rates is not the overall rate when days have different volumes. Sum the counts, then divide.
Moving definitions. A metric that changes meaning breaks comparisons over time. The Search Console page itself warns that some of its heuristics can change.
Undersized groups. A group of twelve visits tells you almost nothing. Report counts beside rates, and be willing to say inconclusive.
Pooled tables. If the variants have a different mix of groups, a total can mislead, as the reversal showed, and a p-value on the pooled rates inherits the problem.
Next step
Take one table you already use. Write down what every column counts and which system produced it. Read it with csv.DictReader so the counts arrive as text, and run validate. Then compute the main rate overall and inside the two groups you think matter most, and test each group and not only the total. If the story changes inside the groups, you have found the first thing to explain. Only then ask a model for a sentence, and require it to quote its numbers from your output.
Sources
- Stanford Encyclopedia of Philosophy, Simpson's Paradox: association reversals in subpopulations, why understanding the paradox matters, and its role in causal reasoning.
- NIST/SEMATECH e-Handbook of Statistical Methods, comparing two proportions: the z statistic from the normal approximation for large samples and Fisher's exact test for small counts, with its worked table.
- Google Search Console Help, What are impressions, position, and clicks?: definitions of impressions, clicks and click-through rate, attribution to the canonical URL, and the note that the heuristics can change.
- OWASP, LLM09 Misinformation: plausible but wrong output, overreliance, and the mitigations of cross-verification, human oversight and automatic validation.