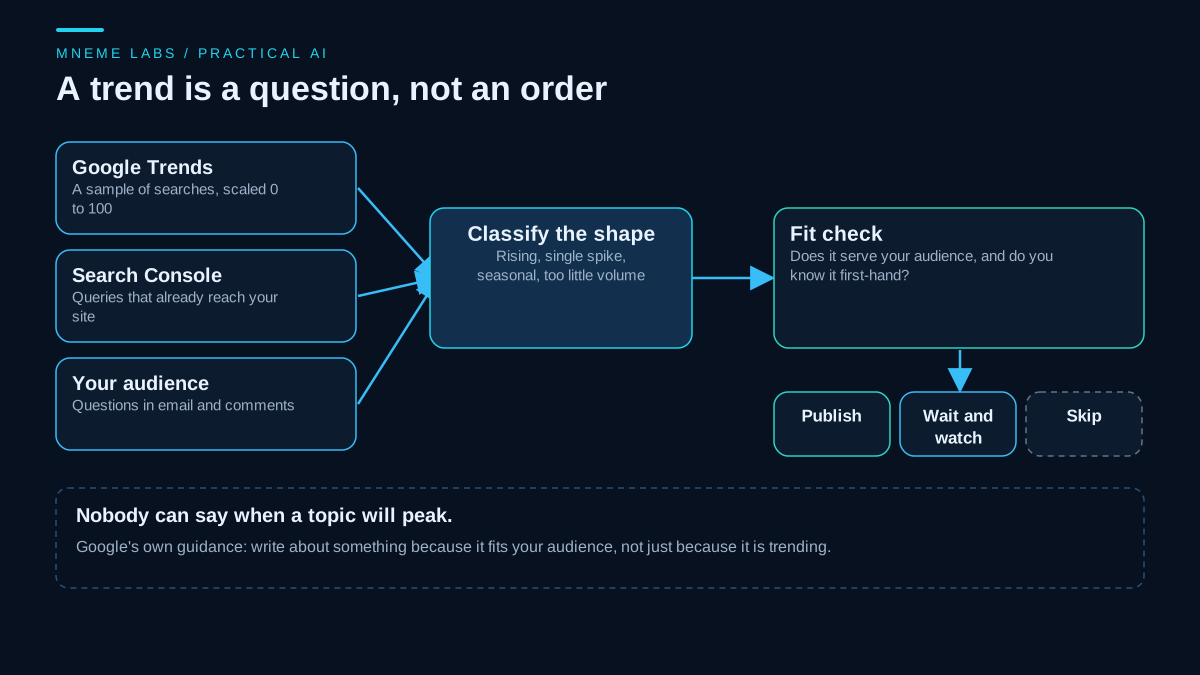
The promise of finding a topic weeks before it peaks is attractive, and no tool keeps it. Search interest depends on news, seasons, product launches, and chance. An AI model has no live view of what people are about to search for. What you can do is read the data that exists with care, notice sustained changes early, and decide whether a rising topic fits your audience and your knowledge.
This guide does that with two official data sources, Google Trends and Search Console, a small script that labels the shape of a search-interest series, and an AI assistant used for the writing and organizing around it. It does not promise early rankings or traffic gains. If you need a steady supply of ideas rather than reaction to trends, see the guide to building a content idea backlog.
What Google Trends is
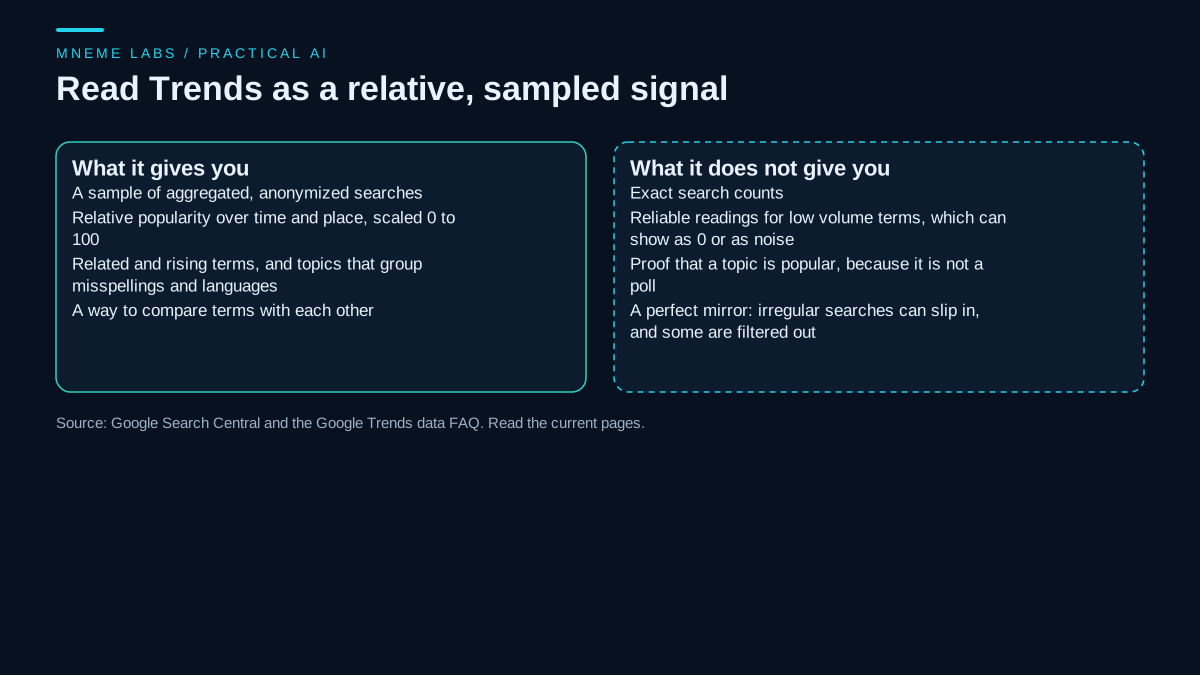
Google's Search Central guide to getting started with Google Trends describes the tool as a random sample of aggregated, anonymized, and categorized Google and YouTube searches. It offers an Explore tool for custom terms and a Trending now tool for what is rising across Google. The guide is clear about how to use the information. It says to use Trends to inform your strategy, to make sure a topic fits your business and your users, and that you should not write about something just because it is trending.
It adds a useful detail about topics. When you search for a topic, as opposed to a term, the data aggregates across languages and includes misspellings, variations, and acronyms. That helps when a subject is commonly misspelled and hurts when you want an exact phrase.
The caveats are in the FAQ
The FAQ about Google Trends data is the page to read before you draw any conclusion. Several points matter for anyone hunting for rising topics:
- The data is a sample of searches. Google considers it representative, but it is not a full count.
- Values are normalized. Each point is divided by the total searches for its place and time range, then scaled from 0 to 100. A chart shows relative popularity, so it does not show how many searches happened.
- Terms with low volume appear as 0, because Trends only shows data for popular terms.
- Duplicate searches from one person over a short period are removed, and queries with special characters are filtered.
- Statistical noise is added to protect privacy. It is most noticeable on queries with low or no search interest, and the FAQ says apparent one-off spikes there should not be read as real search activity.
- Trends is not polling. A spike shows that many people searched for something. It does not show that the topic is popular or winning. Treat it as one data point among others.
- It is not a perfect mirror of search activity.
A topic at the very start of a rise is often low volume, so it sits in the zone where the data is weakest. Anyone who claims to spot a trend weeks early from a small dip in a chart is reading more into the data than the data holds.
Add your own data
Your own site is the other half. The Performance report in Search Console shows clicks, impressions, click-through rate, and average position, and it can group them by query, page, country, and device. The default view covers the past three months. Weekly and monthly views smooth out daily swings from weekends and holidays, which helps when you want to see a sustained change. The newest data can be preliminary and may change within hours. The report also notes that you might not see your site for a query that appears in the list, because results depend on the searcher's time, place, device, and history.
A query that shows rising impressions on your own site is stronger evidence for your audience than a general chart. It is also first-party, so it reflects people who could find you. Your emails, comments, and customer questions add a third source.
A script that labels the shape of a series
When you export a series from the Explore page you get a CSV with a header and one column per term. This script is deliberately narrow: it accepts weekly exports only, meaning the date column is headed Week and the dates are consecutive week starts seven days apart. The reason is the seasonal check, which counts 52 points back as "a year earlier". That is true for weekly data. In a daily export 52 points is under two months, and in a monthly export it is more than four years, so the note would be wrong or never appear. Rather than guess, the script stops with a clear message on a Day, Month or unrecognized export, and on a weekly file that has a missing, repeated or out-of-order week. If you have daily or monthly data, re-export with a date range that Explore returns as weekly, or write a separate check for that cadence. A file that says Week in the header is not proof the dates are right, which is why the dates are checked too.
The script treats <1 as a small value and labels each series from its recent and earlier periods:
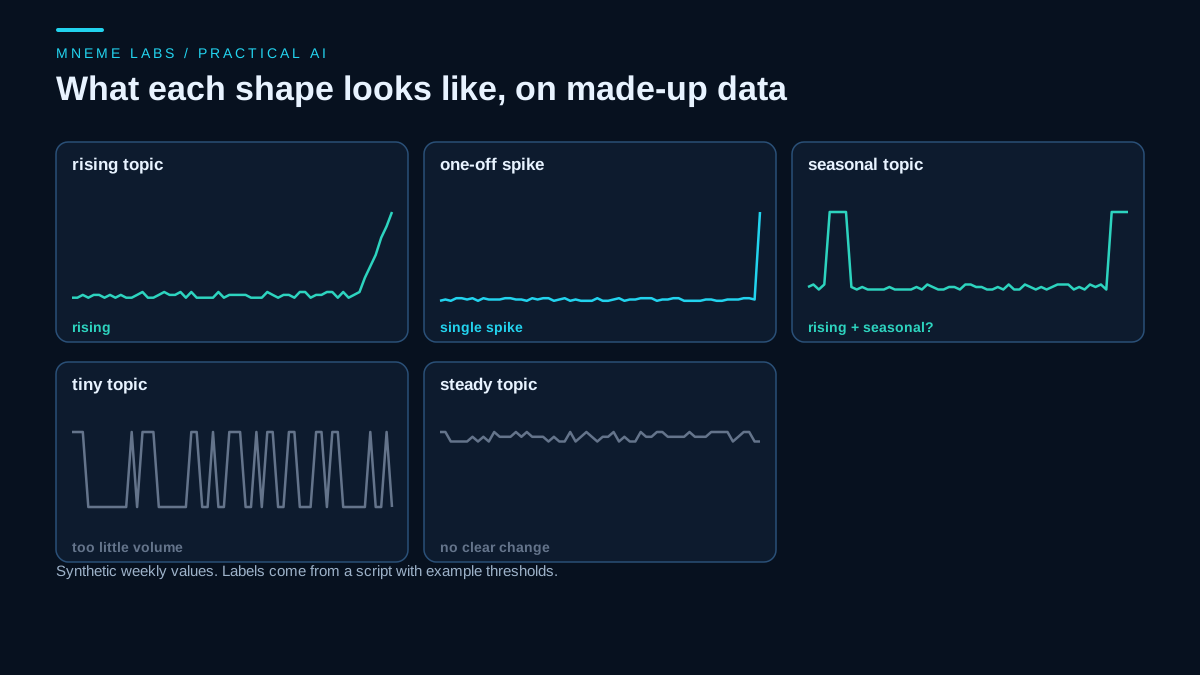
- Too little volume if more than half of the points are zero or below 1.
- Single spike if one recent point is far above the series' typical level and fewer than two of the recent points are elevated.
- Rising for several periods if the median of the most recent points is at least 1.5 times the median of an earlier baseline and nearly all recent points sit above it.
- No clear change otherwise.
If the series has at least 56 weekly points, it also checks the same window 52 weeks earlier and adds a note when that window was similarly high, since a recurring seasonal pattern is not the same as a new trend. With fewer points the note is skipped, and a series that has not been seen across a full year cannot be called seasonal or not seasonal. All thresholds are example values to change after you test them on your own history. The labels are a heuristic about shape. They do not explain why a series moved.
"""trend_check.py: classify weekly search-interest series exported from Google Trends. Standard library only.

  python trend_check.py trends.csv [--recent 4] [--baseline 8] [--ratio 1.5]

Reads the CSV that Google Trends' Explore page exports (header lines, then a Week column plus one column per term).
WEEKLY EXPORTS ONLY, with consecutive week-start dates (YYYY-MM-DD, 7 days apart). The seasonal check counts 52 points
as one year, which is only true for weekly data, so Day, Month and unrecognized exports are refused, and so is a file
with a missing, repeated or out-of-order week. Values like "<1" are read as 0.5. The labels describe the shape of a
sample of search interest, scaled 0 to 100 relative to the series. They do not predict a peak, and they say nothing
about cause. Thresholds are examples: change them and test on your own history.
Exit code 0 = read and labeled, 2 = file refused or unreadable.
"""
import argparse
import csv
import re
import statistics as st
import sys
from datetime import date, timedelta

WEEKS_PER_YEAR = 52  # 364 days, about a day short of a year: close enough for a rough "same time last year" note
DATED = re.compile(r"^\d{4}-\d{2}(-\d{2})?$")


def load(path):
    with open(path, encoding="utf-8-sig", newline="") as fh:
        rows = list(csv.reader(fh))
    first = next((i for i, r in enumerate(rows) if r and DATED.match(r[0].strip())), None)
    if first is None or first == 0:
        raise ValueError("no header row followed by rows that start with a date")
    head = rows[first - 1]
    unit = head[0].strip()
    if unit != "Week":
        raise ValueError("this file is %r data; only Week exports are accepted because the seasonal check "
                         "needs 52 points to equal one year" % unit)
    series = {name: [] for name in head[1:]}
    prev = None
    for n, r in enumerate(rows[first:], start=first + 1):
        if not any(c.strip() for c in r):
            break  # a blank line ends the table
        if len(r) != len(head):
            raise ValueError("line %d: expected %d columns, found %d" % (n, len(head), len(r)))
        try:
            week = date.fromisoformat(r[0].strip())
        except ValueError:
            raise ValueError("line %d: %r is not a YYYY-MM-DD week start" % (n, r[0]))
        if prev is not None and week - prev != timedelta(days=7):
            raise ValueError("line %d: week %s follows %s; weeks must be consecutive, 7 days apart "
                             "(a week is missing, repeated or out of order)" % (n, week, prev))
        prev = week
        for name, cell in zip(head[1:], r[1:]):
            c = cell.strip()
            try:
                series[name].append(0.5 if c == "<1" else float(c))
            except ValueError:
                raise ValueError("line %d: %r is not a number" % (n, cell))
    return series


def classify(vals, recent=4, baseline=8, ratio=1.5):
    if len(vals) < recent + baseline:
        return "too short", "need at least %d points" % (recent + baseline)
    zeros = sum(1 for v in vals if v <= 0.5) / len(vals)
    if zeros > 0.5:
        return "too little volume", "%.0f%% of points are zero or below 1; Trends data is noisy at low volume" % (100 * zeros)
    last = vals[-recent:]
    base = vals[-(recent + baseline):-recent]
    base_med, last_med = st.median(base), st.median(last)
    elevated = sum(1 for v in last if v > base_med * 1.2)
    note = ""
    if len(vals) >= recent + WEEKS_PER_YEAR:
        ago = vals[-(recent + WEEKS_PER_YEAR):-WEEKS_PER_YEAR]
        if st.median(ago) >= 0.8 * last_med and last_med > 1.2 * base_med:
            note = " and similar levels appeared a year ago, so it may recur every year"
    if max(vals[-recent:]) > 3 * st.median(vals[:-1]) and elevated <= 1:
        return "single spike", "one high point, not a sustained rise" + note
    if last_med >= ratio * base_med and elevated >= recent - 1:
        return "rising for several periods", "recent median %.1f vs earlier %.1f" % (last_med, base_med) + note
    return "no clear change", "recent median %.1f vs earlier %.1f" % (last_med, base_med)


def main():
    ap = argparse.ArgumentParser()
    ap.add_argument("path")
    ap.add_argument("--recent", type=int, default=4)
    ap.add_argument("--baseline", type=int, default=8)
    ap.add_argument("--ratio", type=float, default=1.5)
    a = ap.parse_args()
    try:
        series = load(a.path)
    except (OSError, ValueError) as err:
        print("cannot read: %s" % err, file=sys.stderr)
        return 2
    for name, vals in series.items():
        label, why = classify(vals, a.recent, a.baseline, a.ratio)
        print("%-24s %-28s %s" % (name[:24], label, why))
    return 0


if __name__ == "__main__":
    sys.exit(main())
It was tested on a synthetic 60-week file with five terms. The rising term, flat for 54 weeks and then climbing over six, was labeled rising, with a recent median of 28.0 against 7.0. The one-off spike was labeled a single spike. The seasonal term, which had also been high in one earlier window, was labeled rising with a note that similar levels appeared a year ago. The tiny term, 60 percent of whose points were below 1, was labeled too little volume. The steady term was labeled no clear change, with medians of 20.0 and 20.5. A missing file returned a separate exit code instead of a crash. The same script, run unchanged from this page, was also fed files built from that data to check the refusals. A Day export, a Month export, an export headed Quarter and a file with a blank first header cell were each refused with a message naming the problem. A file headed Week but holding daily dates was refused, as was a weekly file with one week removed, one week repeated, or two weeks swapped. The missing-week message names the line and the two dates on either side of the gap. Rows with a non-numeric value, the wrong number of columns or an impossible date were refused too, and so was a file with no dated rows. A table followed by a blank line and a second section was read up to the blank line. The earlier version of the script accepted the daily file and the file with the missing week and labeled both without complaint. These tests use synthetic data only, so they show that the checks fire, not how often real exports break.
The labels describe the past and present of a sample. A series labeled rising can flatten next week. The script cannot see the cause, and it cannot tell you whether the topic belongs on your site.
Where AI helps
An assistant is useful for the surrounding work, with the numbers kept out of its hands:
- Brainstorming angles for a topic you have already vetted, given your audience description.
- Summarizing a list of related queries from Search Console that you paste in.
- Drafting a content brief from the sources you provide.
- Checking for gaps in an outline against what you know first-hand.
A prompt that keeps it honest, as plain text:
Here is a rising search term and the related queries from my Search Console
export. My audience is [describe]. I have first-hand experience with [list].
Suggest three article angles that fit my experience, and say which parts of
each angle would need outside sources. Do not state search volumes, dates or
statistics. If you do not know something, say so.
Do not ask a model whether a topic will peak. It will answer, and the answer will be a guess.
A process for acting on a rising topic
- Track a short list. A few terms in your field are enough. Explore them on a schedule, such as weekly.
- Classify the shape. Run the script. Ignore low-volume series and single spikes unless something else supports them.
- Check your own data. Look for the same terms in Search Console queries and in what readers ask you.
- Apply the fit check. Does it serve your audience, and can you write about it with first-hand knowledge or reliable sources? If not, skip it.
- Decide: publish, wait, or skip. A topic that is rising and fits may deserve a page now. One that is borderline can wait another few weeks of data.
- Review later. After publishing, look at impressions, clicks, and queries for that page, remembering that impressions are not visits and that one page cannot show cause.
Being early comes from preparation, not from prediction: a short publishing process, a set of solid explainers in your field that you can update, and a habit of watching a few terms.
Failure cases
- Chasing a spike. A one-day jump in the news is not a trend, and by the time you publish it may have passed.
- Reading noise. Low-volume terms can show random fluctuations that mean nothing.
- Ignoring seasonality. A term that rises every year at the same time is predictable, which is a different thing from a new trend, and may call for an annual update.
- Writing outside your expertise. Trending topics often involve news, health, money, or law, where mistakes cost readers. Skip them unless you can be accurate.
- Counting competitors by feel. Look at what exists for the topic before deciding it is open.
A next step
Choose five terms in your field and export their Explore data for a range that comes back as weekly data, with Week in the first column of the header and at least 56 weeks, as far as the tool allows. Run the script, read the labels next to the charts, and compare them with your Search Console queries. If nothing is rising, the right decision is to keep working on what you have.
Sources
- Google Search Central, Get started with Google Trends: Trends as a sample of Google and YouTube searches, Explore and Trending now, topics versus terms, and the advice not to write about something just because it is trending.
- Google Trends Help, FAQ about Google Trends data: sampling, normalization to 0 to 100, low-volume terms shown as 0, filtered searches, statistical noise, not polling, and not a perfect mirror.
- Search Console Help, Performance report: clicks, impressions, CTR and position, query and page dimensions, weekly and monthly granularity, and preliminary data.